Tree Diagrams
Simplifying Complexity

© iStockphoto
Smileus
Each idea, solution or event has its own "branch."
We might associate tree diagrams with high school math; as simple tools commonly used to calculate probabilities or chart a series of events. However, they can be useful in the workplace too. They can help you analyze options, solve problems, and brainstorm different ideas with your team.
In this article, we'll look at what tree diagrams are, and discuss the many powerful ways you can apply them.
What Is a Tree Diagram?
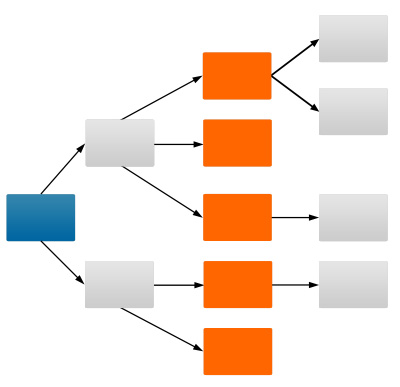
A tree diagram is a visual depiction of relationships that starts with a central node, or "trunk." This is the problem that needs solving or the idea you are analyzing. Each possible solution or event has its own "branch," which comes off the trunk to the top or bottom right-hand side. Additional decisions, consequences or effects split off from each of these "second layer branches," giving the diagram a tree-like structure.
You can use tree diagrams to break down categories or events into finer and finer levels of detail. This helps simplify complex problems (and their proposed solutions), and makes it easier for you to get an overview of your options.
Figure 1 – Example Tree Diagram

Among other uses, tree diagrams can help you to:...
Access the Full Article
This article is only available in full within the Mind Tools Club.
Learn More and Join TodayAlready a Club member? Log in to finish this article.


