Flow Charts
Identify and Communicate Your Optimal Process
How often have you thought about streamlining a process in your organization but not been sure where to start? Or perhaps you've struggled to understand a process when it's described to you in detail.
Flow charts are a useful tool in these situations, as they make a process easy to understand at a glance. Using just a few words and some simple symbols, they show clearly what happens at each stage and how this affects other decisions and actions.
In this article and video, we look at how to create and use flow charts, and explore how they can help you to solve problems in your processes.
Click here to view a transcript of this video.
What Is a Flow Chart?
Flow charts are easy-to-understand diagrams that show how the steps of a process fit together. American engineer Frank Gilbreth is widely believed to be the first person to document a process flow, having introduced the concept of a "Process Chart" to the American Society of Mechanical Engineers in 1921.
Flow charts tend to consist of four main symbols, linked with arrows that show the direction of flow:
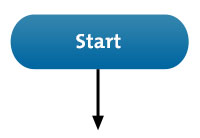
1. Elongated circles, which signify the start or end of a process.
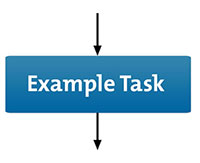
2. Rectangles, which show instructions or actions.
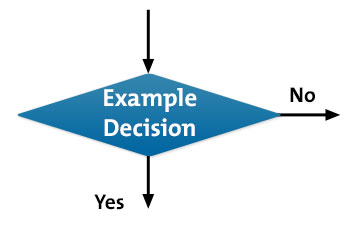
3. Diamonds, which highlight where you must make a decision.
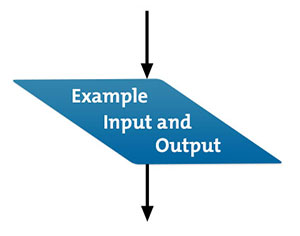
4. Parallelograms, which show input and output. This can include materials, services or people.
Tip:
You can use many other symbols in a flow chart but remember that these diagrams are used for communication. If you use symbols that only a few people understand, you may fail to get your message across. So, be sure to keep things simple!
When to Use a Flow Chart
All manner of organizations use flow charts to:
- Define a process.
- Standardize a process.
- Communicate a process.
- Identify bottlenecks or waste in a process.
- Solve a problem.
- Improve a process.
For example, software developers can use them to work out how the automated and manual parts of a process join up. Inexperienced team members might follow a flow chart to help them to complete activities in the right order. A manufacturer could ensure that it keeps to its values by applying a quality-control flow chart that presents questions and decision points. And an HR department might combine a flow chart with an organogram to show people who to contact about issues and when.
Why Use Flow Charts?
This tool's simplicity makes communicating and documenting a process quick and clear, so that the process will more likely be understood and applied correctly and consistently. It can also help you to estimate the timescale of the process, as you're better able to gauge the time needed for each task along the way. And you'll more likely identify who you should involve and at what stage, such as senior management or a compliance authority.
But you can also benefit from the process of creating a flow chart itself, as you build it step by step. You'll be able to focus on the detail of each individual stage, without feeling overwhelmed by the rest of the process, and then "zoom out" again to see the wider picture.
Tip:
If your process or project involves several people or teams, you might find it more useful to use a Swim Lane Diagram rather than a flow chart – this helps you to show process flows between people and teams.
How to Create a Flow Chart
Follow these four steps:
Step 1: Identify Tasks
Begin by listing all of the tasks in a process in chronological order. Ask questions such as, "What happens next in the process?" or, "Do you need to make a decision before the next step?" or, "What approvals are required before you move on to the next task?"
Put yourself in the shoes of the person using the process, possibly for the first time. Talk to team members who work with the process directly, and get their opinions on where improvements could be made. Better yet, take a hands-on approach and go through the procedure yourself, and think about the practicalities of each stage. Use Customer Experience Mapping if your flow chart focuses on customer service, so that you can gain a better understanding of the process.
Step 2: Organize and Document Tasks
Next, start your flow chart by drawing the elongated circle shape and labeling it "Start."
Then, work through your whole process, and show the actions and decisions in the order that they happen. Link them with arrows to illustrate the flow of the process.
Where you need to make a decision, draw arrows from the decision diamond to each possible solution, and then label each arrow with the decision made. Remember to show the end of the process by using an elongated circle labeled "Finish."
Step 3: Double-Check the Process
When you've completed your flow chart, go back to the start and try it out to make sure that you haven't overlooked anything. Work through each step, and ask yourself whether you've represented the sequence of actions and the decisions involved correctly. Are there more decisions to be made at certain stages?
Then show your flow chart to other people, especially those who work directly with the process. Ask them to test that it works and to tell you if there are any problems or omissions.
Step 4: Challenge the Flow Chart
Finally, you might want to improve the process rather than just record it. So, see whether any of the steps that you've described are unnecessary or overly complicated. Identify any major bottlenecks, and deal with them to improve performance.
Are there any missing steps, no matter how small or seemingly insignificant, that you should add? And have you assigned tasks and decisions to the right people or automated them where it's most appropriate? Make any changes and then challenge the chart again.
Tip:
As you challenge your flow chart, you might also be challenging your team members' tried and tested ways of working. So, take time to win support for your ideas and don't expect to change people's habits overnight.
You may find that SIPOC diagrams will give you the detailed information that you need to introduce change in a controlled and effective way.
Flow Chart Software
You'll likely start with drawing flow charts by hand, but it's often more convenient to use a diagramming app to save, amend and share your charts.
Such apps vary from the simple and free, such as draw.io, creately and Pencil Project, to the more complex and paid-for, such as gliffy™, Lucidchart, SmartDraw™, and Visio®.
Tip:
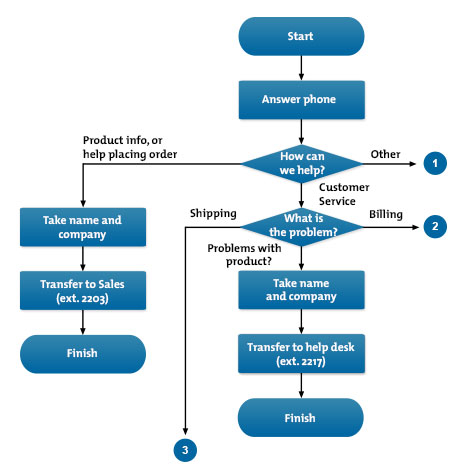
Flow charts can quickly become long and complicated, so that you can't represent them on a single piece of paper. This is where you can use "connectors" (shown as numbered circles) to link the flow when moving from one page to another. The user can follow the matching numbers to trace the flow of the process.
Example
The image below shows part of a flow chart for how the receptionists in an example company should route incoming phone calls to the correct department:
Key Points
Flow charts are simple diagrams that map out a process, so that you can easily communicate it to other people. You can also use them to define and analyze a process, build a step-by-step picture of it, and then standardize or improve it.
To draw a flow chart, identify the tasks and decisions that you make during a process, and write them down in order.
Then, arrange these steps in the flow chart format, using the appropriate symbols.
Finally, check and challenge your flow chart to make sure that it accurately represents the process, and that it shows the most efficient way of doing the job.
This site teaches you the skills you need for a happy and successful career; and this is just one of many tools and resources that you'll find here at Mind Tools. Subscribe to our free newsletter, or join the Mind Tools Club and really supercharge your career!


This is a good example of a simple flow chart. Can you think of any dependent tasks that you could add? Such as, what to do if there is cross traffic at Amber; or what output if traffic ahead is stopped on Amber?
Thank you for your comment.
BillT
Mind Tools Team
Asks the user to input the traffic light colour.
If the traffic light colour is green, outputs ‘Go.’
If the traffic light colour is amber, outputs ‘Get Ready.’
Otherwise outputs ‘Stop.’
Maybe the question mark you saw was a symbol for a question, meaning that the student had to come up with a suitable question. There needs to be a question in the diamond that will take the process either in one direction or the other. I hope that helps?
Yolandé
Mind Tools Team